Researchers from ENEA Use the SentinAir System and the Model 106-L to Calibrate and Evaluate CO2 Low-Cost Sensors
The Problem: Low-cost gas sensors are an alternative for monitoring air quality in indoor or outdoor environments. However, their performance depends on their operational measurement technique and data quality can vary in a remarkable way. Additionally they need to be calibrated at the site where they are going to be deployed to maximize the quality of their performance. In indoor environments, CO2 monitoring is crucial toward maintaining good air quality levels. In several situations this operation is performed through low-cost gas sensors, but to effectively accomplish this task CO2 sensor performance has to be carefully evaluated and accurately calibrated if necessary. Evaluation or calibration of low-cost sensors is performed by comparing data from a reference instrument with the sensor output.

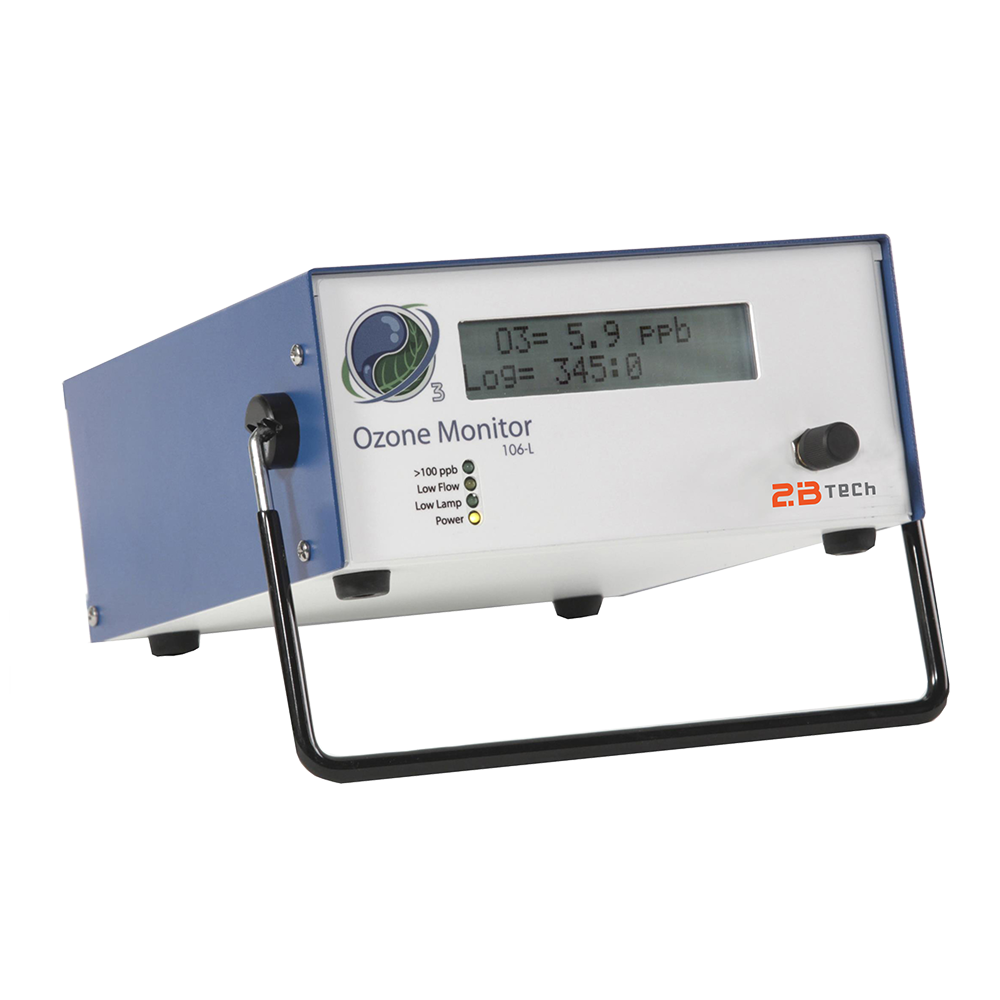
The Solution: A reasonably quick way to evaluate or calibrate CO2 gas sensors in indoor environments is by using the SentinAir system and the Model 106-L by 2B Technologies equipped with the CARBOCAP Carbon Dioxide Module GMM112 by Vaisala. By the use of both these instruments users, can proceed to a quick evaluation of CO2 gas sensors, such as the IRC-A1 by Alphasense and the TDS0058 by Dynament which are both installed inside the SentinAir device. The Model 106-L acts as the CO2 reference instrument and with its serial port connected to the SentinAir device through a USB adapter for data acquisition. No other devices or instruments are necessary for this operation.
Results: Data produced by the 2B instrument and the two CO2 sensors are stored in records with timestamps composing a CSV (Comma Separated Values) file downloadable from SentinAir. By considering the values coming from the Model 106-L as the reference, it is possible to apply a linear regression model to assess sensor performance or for calibration purposes. The correlation coefficient (R2), the intercept, the slope of the model, the mean absolute error (MAE), and the standard deviation (SD) are indicators that help determine sensor performance. An example of data coming out from the above depicted instrument setup can be found in Figure 1, while the indicators calculated from them are summarized in Table 1, and Figure 2.

Table 1: Indicators of CO2 performance calculated from the linear regression mode.
Sensor R2 MAE SD Slope Intercept
IRCA1(1) 0,934 144,245 64,469 1,055 102,836
TDS0058(1) 0,985 121,211 32,277 0,954 153,947
Click here to view the full paper: https://doi.org/10.1155/2020/8812025
The 2B Tech Instrument’s Role: The Model 106-L with an integrated CO2 sensor was used as the calibration reference for the low-cost sensors in this study. By calibrating the sensors against the Model 106-L reference they could be confidently deployed as a means of measuring air quality in either indoor or outdoor environments. This version of the Model 106-L is referred to as the “GO3 CO2 Experiment Package” and was sold as an optional upgrade to the Model 106-L by 2B Technologies up until 2017. Measurements of CO2 are now available as part of our Personal Air Monitor (PAM), the AQLite-Standard Air Monitoring Package, and the AQSync Air Quality Monitoring Station. In addition to CO2 the PAM, AQLite, and AQSync are capable of measuring carbon monoxide (CO), fine particulate matter (PM1, PM2.5, and PM10), temperature, pressure, and relative humidity.

The Bottom Line: Although the GO3 CO2 Experiment Package is no longer offered by 2B Technologies, we have a variety of other products capable of providing CO2 measurements for your application. In addition to the PAM mentioned above, the AQSync and AQLite offer Federal Equivalent Method (FEM) quality ozone measurements along with measurements of CO, CO2, PM1, PM2.5, PM10, temperature, pressure, and relative humidity. Both the AQLite and AQSync are housed in weatherproof enclosures and can be mounted in a fixed location (e.g., on a light pole), and we offer an outdoor enclosure option for the PAM. The devices have the ability to upload data directly to our online database where it can be viewed on a Google Earth style overlay or downloaded by the end user as a CSV file.
The AQSync Air Quality Monitoring Station is an all-in-one instrument for measuring of the most important air pollutants, including customizable choices for measuring O3, NO, NO2, CO, CO2, PM1 and PM2.5, along with ambient temperature (T), pressure (P), relative humidity (RH), wind speed, and wind direction. The package uses FEM-grade measurements for O3 and NO2 while employing proven and accurate measurement techniques for the other pollutants. The AQSync offers cellular connectivity so the collected data are automatically uploaded to our online database where it can be accessed and downloaded by the customer. The AQSync can serve as a drive-by calibration station for emerging sensor networks. These sensors can be collocated with the reference-grade measurements offered by the AQSync and their calibration parameters can be adjusted prior to field deployment. The AQSync can also serve as a complete air quality monitoring station in data-sparse communities and in developing countries. Instead of purchasing an entire array of expensive instrumentation, these customers will be able to purchase a single AQSync for their monitoring station. This will reduce infrastructure cost while maintaining the ability to monitoring air pollution in accordance with local government regulations.
The Model 106-L Ozone Monitor is approved as a FEM for ambient ozone monitoring. The instrument has been certified to measure ambient ozone concentrations between 0-500 ppbv. The instrument has an accuracy of 1.5 ppb or 2% of the reading (whichever is greater). The instrument can be provided in a standard benchtop enclosure, wall-mount weatherproof enclosure, or as an OEM version.
Please contact 2B Technologies to discuss using the Model 106-L, PAM, AQLite, or AQSync for your air monitoring application.